

SMARTViz
Our advanced visualization technique allows us to get a deep understanding of the in-field aerodynamic performance of the wind turbine blade. SMART BLADE offers this service to both turbine operators and manufacturers since 2012.
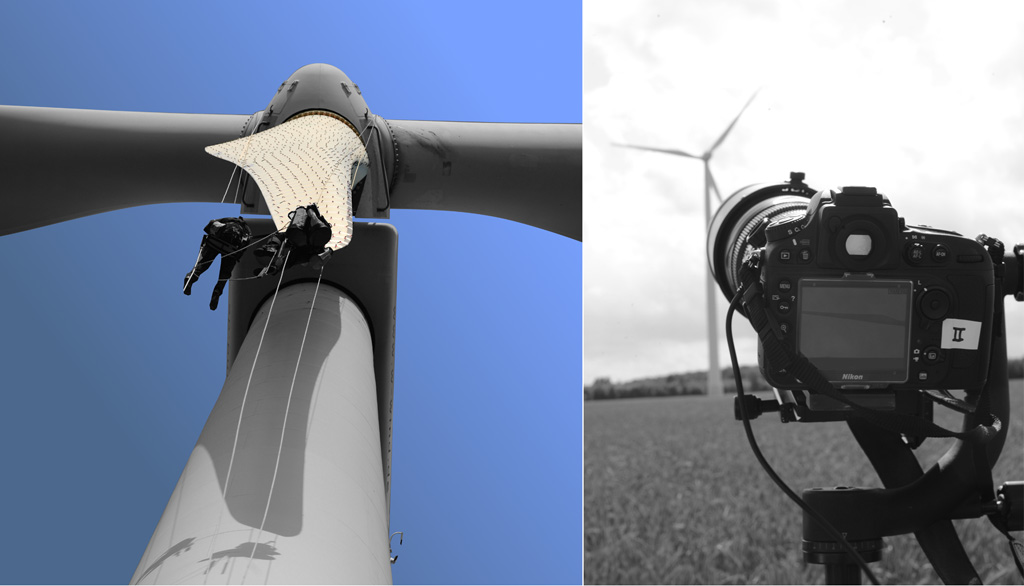
THE TECHNIQUE
The method combines a classical flow tuft visualization with a per tuft statistical analysis over the complete operational range of the turbine. Whether you want to identify steady stall regions in the blade root or sources of noise at the blade trailing edge or want an experimental validation for your CFD calculation, the SMARTViz technique offers you a deep aerodynamic insight in the flow around your blade.
Your benefits
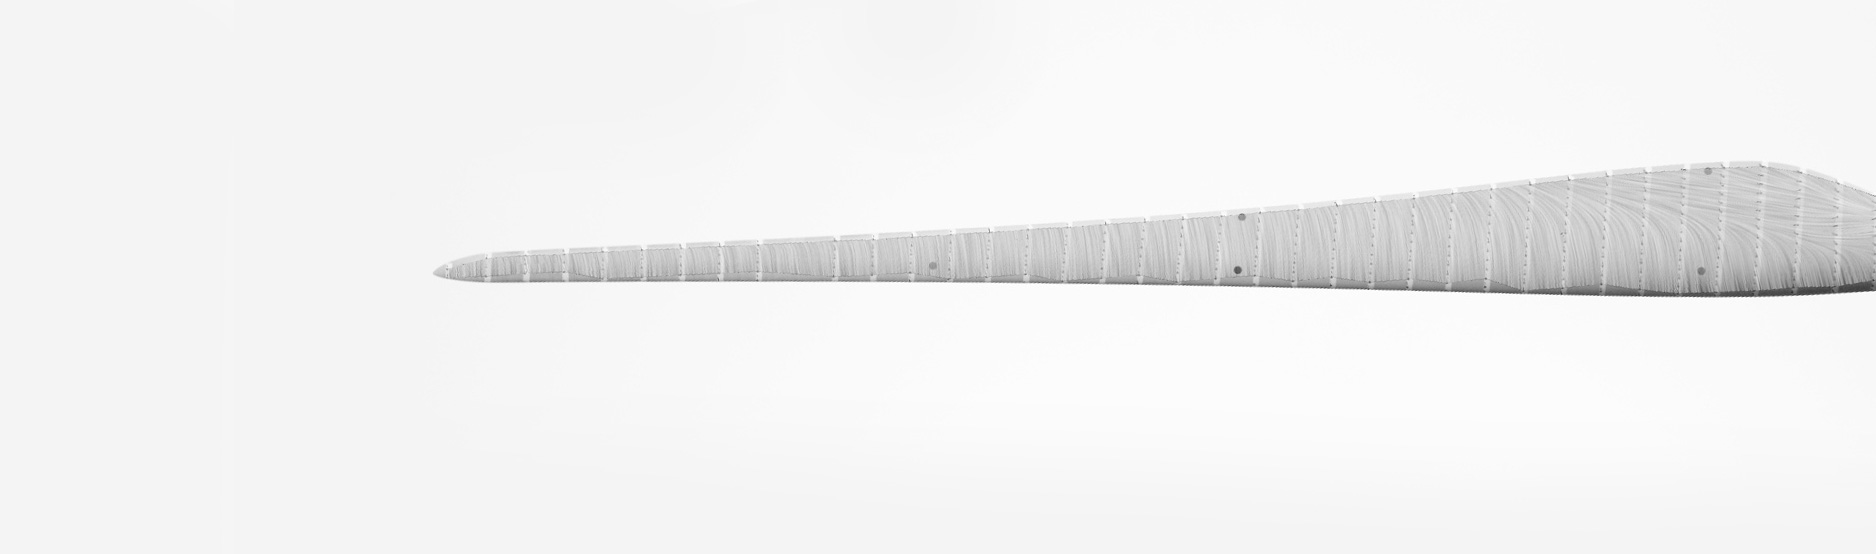
The results of a SMARTviz process include various spatial and temporal aerodynamic flow characteristics and higher order statistical information. Some of the typical results are presented below:
Mean flow direction (streamlines).
Streamline variation in different wind speed regions (or other operational regimes).
Streamline variation for various rotor positions.
Statistical information on the standard deviation of each flow tuft.

Standard deviation of flow tuft angles on a >50m blade.
Interpolated streamlines showing the root region cross-flow on a >30m blade.

Extent of flow separation for different power regions.
Why we use it ourselves
We use this deep analysis of the blade aerodynamics in actual field conditions for all our VG solutions. Armed with a highly accurate map of the blade aerodynamics, a VG solution is designed specifically for that unique blade design. Unlike with most other VGs available, our process allows for the flexibility to place each individual VG in exactly the right location and orientation resulting in maximum AEP gains.

Contact us for a demo report